
How Netdata was born
In 2013, I worked for a company that relied on financial transactions. We had a very simple SLA: complete all financial transactions within 3 seconds.
We were migrating the infrastructure from colocated (physical servers) to the cloud (VMs). The transition was not smooth. We had a lot of issues on the cloud side, which we couldn’t even detect. Business metrics were randomly reporting significant loss of volume and a very bad SLA, but at the operational level we saw no issues—everything seemed to be working perfectly. Traces were showing a large delay in several transactions, but there were no failures.
To monitor it, we were using Zabbix and a huge Hadoop cluster, on top of which we ran OpenTSDB (for metrics) and various parts of the Elastic stack for logs.
When we realized we had no visibility on the operational issues, we started evaluating commercial alternatives. For several months we tried almost all commercial solutions and SaaS offerings that existed at that time. We were even running several of them in parallel to see if one could detect the issues. Still, zero visibility on the operational issues.
Our company was one of the biggest customers of the hosting provider in that region, so we had their attention. They provided a lot of professional services to help us figure out the problem. Senior consultants and developers of the hosting provider reviewed our applications, their design, even their implementation (yes, the actual code). Every step of the migration was first reviewed and approved by the hosting provider. It was a long process, since they were giving us recommendations to refactor parts of our applications to make them more “cloud friendly” prior to migrating them, which of course we did.
But still no luck. We were still randomly experiencing significant loss of transaction volume.
So, in 2014, having refactored significant parts of our infrastructure to comply with what they thought was “the cloud way,” and having evaluated almost every possible monitoring solution out there, there was a lot of frustration. We were exhausted. And we were spending twice as much as hosting, on monitoring—monitoring that didn’t actually work.
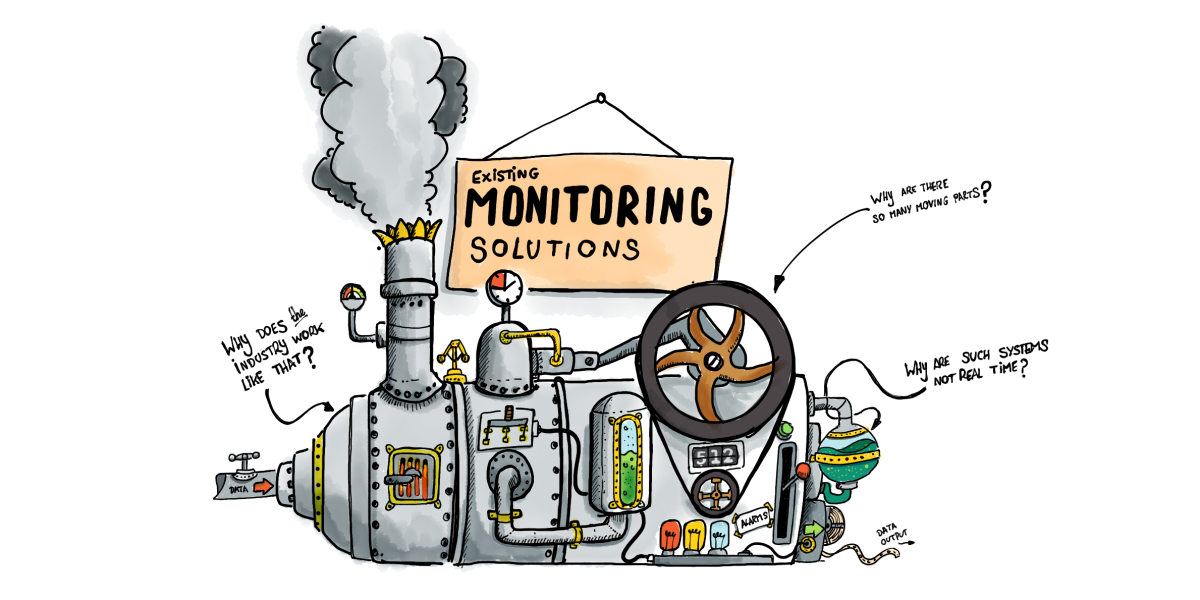
I recall spending countless hours at our monitoring dashboards, feeling that their sole purpose was to make us happy with an illusion of monitoring. I couldn’t accept that monitoring must be limited to providing just an abstract view of the operation of our systems and applications, so static, inflexible and inefficient, that it was almost useless for troubleshooting. I couldn’t believe that monitoring systems provide so few metrics and with such low resolution, scale so badly, and cost so much to run. But most importantly, I couldn’t accept that all solutions relied so heavily on the engineers installing and configuring them; inevitably, the final result was just a reflection of these engineers’ skills. Not to mention the time required to set them up, which in many cases was counted in months.
Why does the industry work like that? Why don’t they use all the metrics? Why are such systems not real-time? Why are they not optimized for troubleshooting issues? Why are there so many moving parts? Why do all of us have to go through the same complex configuration steps again and again, even when it comes to monitoring standardized systems and apps? Is it so hard to do it the other way around? Is it impossible?
I started experimenting, at home, on nights and weekends. I was rusty, but I knew that such a system had to behave well, to control itself, to show great respect to the systems and the other applications running, to be extremely lightweight, fast, and to have the smallest possible footprint.
I used the C language. And, of course, there were some trade-offs: I decided to eliminate disk accesses entirely, since these can affect the performance of the system significantly. In the end, Netdata had, by default, just an hour of data retention. (Today, with our custom database engine, Netdata can store much more than an hour’s worth of data!)
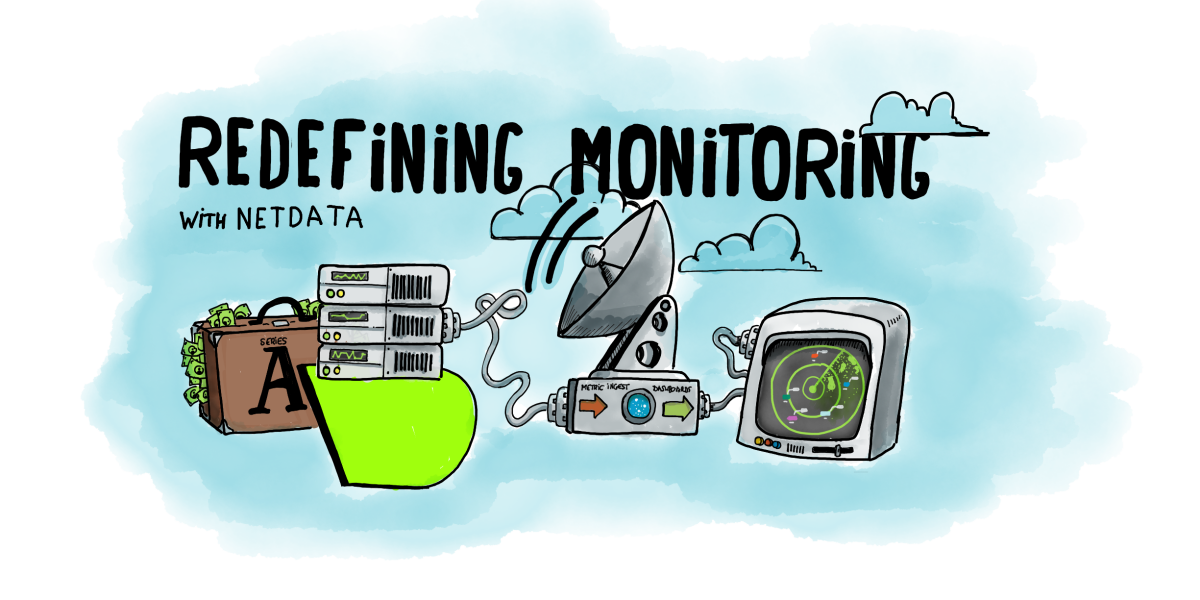
My intention was never to build a monitoring tool. What I needed was a “console killer”: a tool that will always be running on all systems, that will zoom in to the heart of the operation of our systems and applications. A tool that’s so friendly, diverse, adaptive, open and dynamic that it will replace the console for troubleshooting performance issues, once and for all.
Netdata was born.
Of course, we used Netdata in production from the very beginning and installed it everywhere. It helped us understand our infrastructure in great detail and surfaced all the problems we were facing.
We found issues in the cloud provider’s infrastructure and operations: their provisioning system and host maintenance were randomly introducing short (1-3 second) freezes to the guest VMs, hundreds of them daily on each VM, in bursts. We identified bugs in their storage throttling mechanism, and even problematic top-of-rack switches.
We also managed to figure out how the operations of the hosting provider differ between VM sizes. I recall issuing a policy like “the smallest VM we should use should be 4 cores, 16GB RAM,” because we knew this was the minimum with acceptable quality.
With Netdata, such problems were so easy to figure out and document, even from within the VMs.
Netdata’s first release
For quite some time, I was a COO during the day and an open-source developer and maintainer on nights and weekends. It was harsh, but I must admit it was fun. I recall long periods of my life, going to bed early in the morning, extremely tired and exhausted, but unbelievably happy that I was building something so unique, confident that it will influence the lives of so many.
So, in March 2016, after using it successfully for a couple of years, I felt that Netdata was good enough to be released to the world. So on March 22, 2016 I pressed that GitHub button to release it! Wow! I was proud!
But, nothing happened…
Where is everyone? It was just me and a couple of friends using it.
Hm…
I wrote a blog post and sent it to Linux sites I trusted. They were not interested in publishing it. 😞
What the hell, was I the only one who needed this? It couldn’t be…
I started reading about it. Οn the morning of March 30th, 2016, just before I went to work, I found a blog post saying that if you want to check how good your open source project is, post it on Reddit. So, while I was having my first coffee for the day, I improved the readme file on GitHub and wrote this Reddit post. Then I left for my office.
It was a busy day. I had several meetings in the morning. I was just finishing a meeting when one of my engineers was waiting for me just outside the meeting room. He came and said “Costa, you are on Hacker News!”. I thought, “Hacker… news… WTF? What did I do?”
(Yes, I was not aware of Hacker News, so someone else posted this.)
I walked to my office, turned on my laptop, and checked my personal mailbox. I was flooded! Hundreds of people all over the world were sending me emails and invitations to connect on social media, giving Netdata stars on GitHub like crazy, and providing feedback by opening dozens of GitHub issues. The Netdata demo site I had running was sustainably sending dozens of thousands of chart refreshes per second. It didn’t crash—phew!—because I had done load testing before and knew it would perform.

Netdata reached 10,000 stars on GitHub in just a couple of weeks. It was now the top trending project on GitHub for all languages. It stayed there for about 2 months, after which GitHub included Netdata in its annual GitHub Octoverse for 2016 list.
The success of the project encouraged me to keep working on it more passionately than ever. I was still a COO during the day, but now I dedicated all my personal time to it, including my vacations. I added the Netdata registry, health monitoring, alarm notifications, streaming, exporting to time-series DBs, and improved it in almost every way. Of course, I now had a lot of feedback and great help. New ideas were flowing in, common needs were identified, exotic use cases were discussed, bugs were reported, and even code and quality contributions were committed, all by complete strangers who found value in what I had created.
Isn’t open-source amazing? You give people value and you get a lot of value back!
So, what made Netdata so unique? Why do people seem to like it so much?
What Netdata does differently
My target persona was never Brendan Gregg. Brendan and the other monitoring gurus out there can do great things by themselves and do not really need me, or Netdata. My focus was the people who have the responsibility to run or troubleshoot infrastructure, but do not have the time or the resources to monitor it properly. These are people in need. They struggle. They need real help and they need it now. And there are really a lot of them—they are the vast majority of SysAdmins, SREs, and DevOps out there.
So, I built Netdata around the following principles, which I believe are also the reasons people fall in love with it.
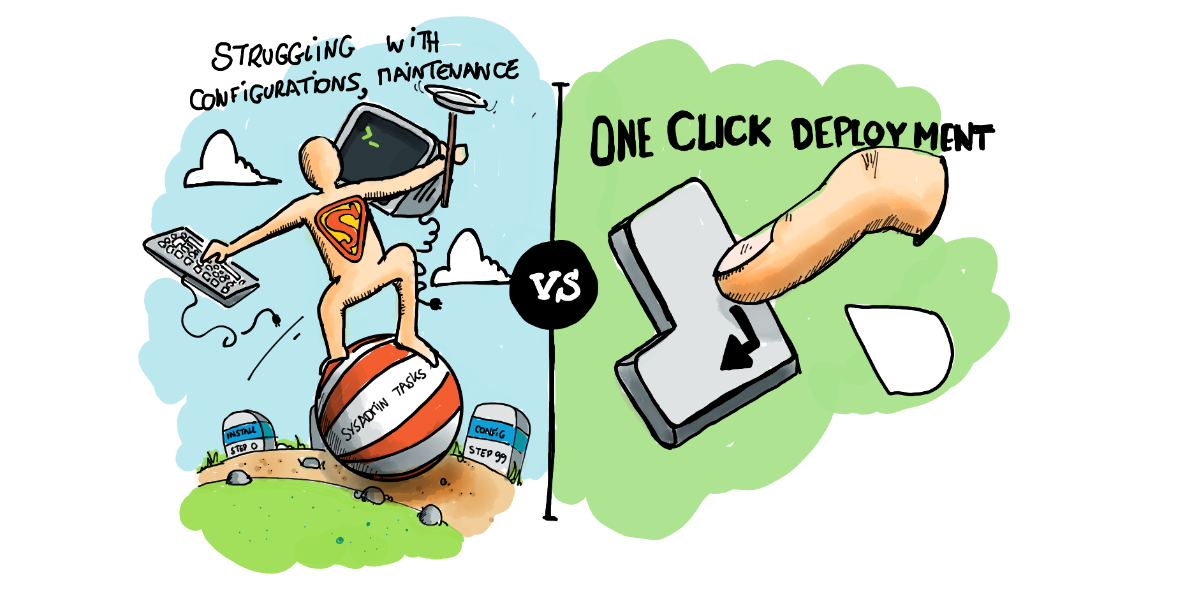
1. Just one-line deployment
Zero configuration. Zero maintenance. No preparations. Sane defaults. Auto-detection for all metrics. Immediately usable.
People just install Netdata and, seconds later, they have a fully usable monitoring system, with impressive dashboards (better than they could ever configure themselves using other solutions) and hundreds of alarms attached.Once launched, Netdata auto-detects all the metrics, enables and disables data collection plugins by itself, and immediately gives the users useful and actionable information, using minimal system resources. It is easy and safe to be installed everywhere.
2. Unlimited metrics
Netdata collects, stores and visualizes all the metrics available. We almost never filter out metrics. The more metrics, the better.
This is against the most fundamental instructions provided by monitoring text books and blogs. The first thing they say is, “You have to carefully select the metrics you monitor and you have to have a deep understanding of their meaning.”
Well… no! This does not work. No one can do this. There is no single person (with the possible exception of Brendan) who can have a deep understanding of network infrastructure, operating system architecture, detailed hardware operations, and adequate knowledge of the internals of the applications they use.
The only way to provide unlimited metrics was to incorporate information about the metrics inside the tool. The tool should have a deep understanding of the technologies it monitors and it should know what each metric is and how it correlates with other metrics, and the tool should make an effort to help people understand them all. The tool should make information available when the user needs it.
3. 1s granularity / high resolution metrics
Netdata is real-time. It collects all metrics every second and it has a data collection to visualization latency of less than a millisecond.
This provides immediate visibility and greater granularity into the state and performance of the infrastructure and applications, such as observing short-lived spikes or gaps. It is especially useful in today’s cloud environments, where the performance of the infrastructure is neither linear nor predictable.
Without high resolution (1s granularity) metrics, we are actually blind. We can only have a helicopter view of the infrastructure, where most of the issues are not even visible.
4. Stunning visualization
Netdata is a troubleshooting tool—not a dashboard. These two are quite different.
A dashboard is something static, pre-configured and finite, which is being refreshed with new data every few seconds or minutes.
A troubleshooting tool is something a lot more flexible and dynamic. It provides the means for exploring and working with all the metrics, in a meaningful way. And, of course, its speed is very important for its efficiency.
Of course there are many more key features of Netdata that matter. For example, Netdata is integrable and can interface with almost all existing monitoring solutions. It is also extensible, built from the ground up as multiple layers of plugins. It is embeddable, so that it can be used almost everywhere, both as an agent and as a visualizer. And many more.
So, what’s next? Netdata is now a company. What will happen to it?
The future of Netdata
Our first goal is to have the Netdata agent installed on every computer node on this planet. It is and will always be free, open-source software and we plan to significantly improve it.
We now have a dedicated team of about 10 full-time developers working on it, with a plan to make them 20 by the end of 2020. We plan to add automated anomaly detection, logs collection and visualization, application traces collection, improve all its aspects (database, health monitoring, streaming, archiving, query engine, visualization, etc), satisfy many more use cases, and make it the fastest and the most capable monitoring agent out there.
It is our gift to the world.
We’re also trying to solve a couple more problems.
All other monitoring solutions are limited because they centralize all the data. To scale and control the cost of their solutions, they limit the number of metrics and the frequency with which they are collected.
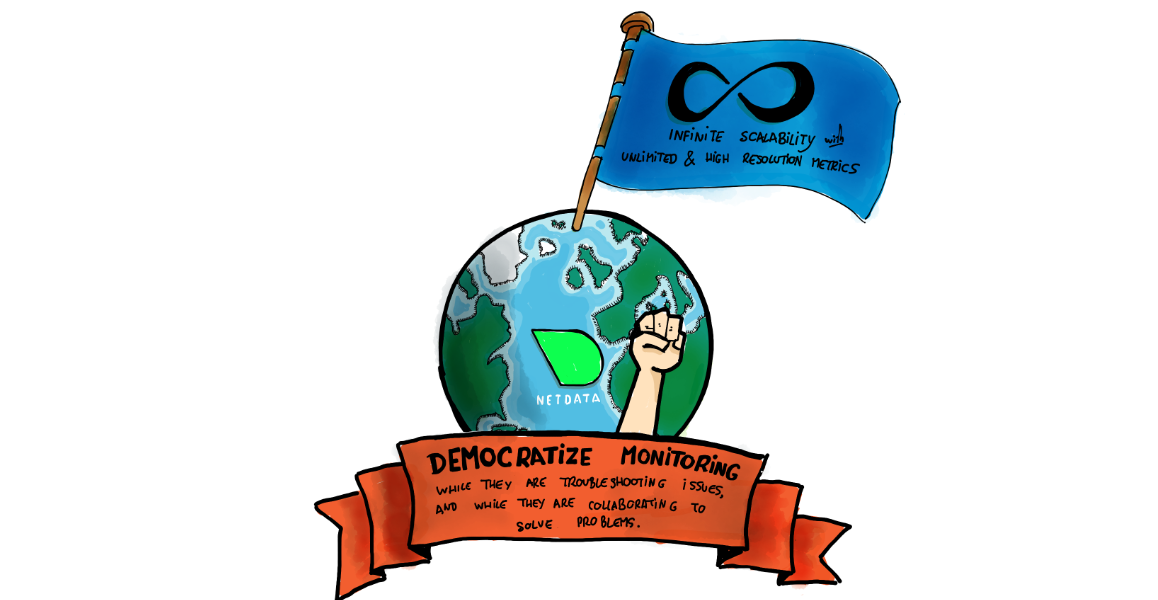
We believe we can lower the cost of monitoring drastically by utilizing the open-source Netdata agents as a distributed database. We are going to centralize some metadata, of course, but by avoiding the centralization of the metrics values, we believe that we can build a solution that will require just a fraction of the resources other solutions need. We believe we can achieve infinite scalability with unlimited and high-resolution metrics!
The second problem is collaboration. Today, most of the monitoring solutions are static. Change management goes through a development lifecycle that is slow, expensive, and requires a lot of scarce resources.
But monitoring should be dynamic. It should be able to quickly adapt to the specific needs users have, immediately after they realize they have these needs. We believe we can build a solution that will allow people to customize their monitoring infrastructure, while they are troubleshooting issues, and while they are collaborating to solve problems.
So, our primary target is to “democratize” monitoring: To help the people who find it hard to properly monitor their infrastructure. This is why we strongly believe that we’re building the future of distributed health monitoring and performance troubleshooting.
We have a lot more in the works and are still working out the details of how we will bring all of this great functionality to the market, but we aim to provide most of it for free, forever, and for everyone.