
We’re in the middle of a scary, uncertain time, and we hope those of you reading are staying safe and healthy.
Despite the current challenges, the 40+ members of the remote-first Netdata team have been hard at work on the next version of the Netdata Agent: v1.21.0.
This release is foundational: While we do have fantastic new collectors and three new ways to export your metrics for long-term storage, many of the most significant changes aren’t even those you’ll notice. While they may be beneath the hood, they’re going to power some amazing new features, UX improvements, and design overhauls.
New collectors to support our infrastructure
We added two collectors in v1.21: Apache Pulsar and VerneMQ. We’re excited to bring sophisticated real-time health monitoring and performance troubleshooting to these two complex systems. We use both in the Netdata Cloud infrastructure (more on that soon!), and plan on sharing the real-time metrics from our production systems with the Netdata community.

Apache Pulsar is an open-source distributed pub-sub messaging system that comes with geo-replication, multi-tenancy, great scalability, and a lot more. Our Pulsar collector auto-detects your installation and instantly generates more than twenty charts on messages/second, throughput rate, storage size, topic producers/subscriptions/consumers, and much more.
You can always configure the collector based on your unique setup.
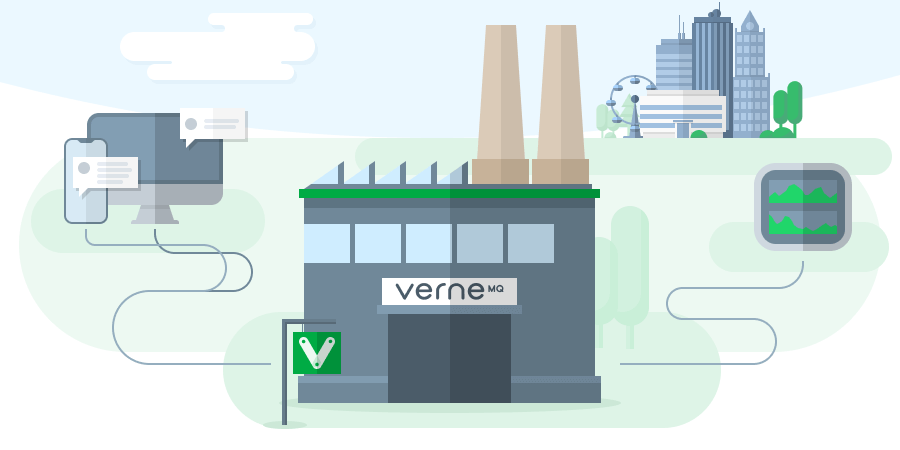
VerneMQ is an open-source MQTT broker designed to connect devices in low-bandwidth, high-latency, or unreliable networks. The new VerneMQ collector produces a sizeable 61 charts that cover everything from sockets, queues, subscriptions, and bandwidth to the Erlang VM that powers it.
You can start monitoring the health of your VerneMQ installations in a matter of minutes with this new collector, which is also entirely configurable to your infrastructure.
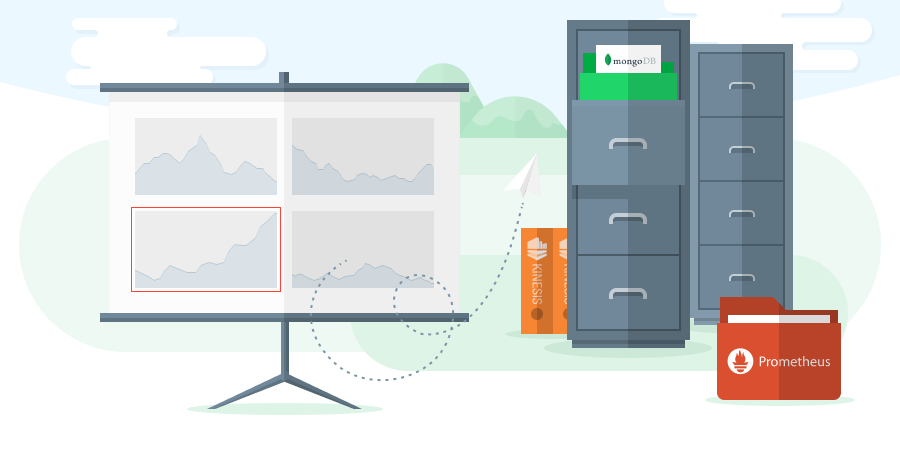
Export to Prometheus remote write, MongoDB, and AWS Kinesis Data Streams
Our experimental exporting engine is coming along nicely. As of v1.21, you can now export and archive the real-time, per-second metrics your Agent collects to more than 20 different external storage providers.
Why would you want to export your metrics outside of the Agent? It already has long-term metrics storage with the database engine, after all. The exporting engine is part of our mission to be as extensible, flexible, and compatible as possible. You might want to export your metrics to:
- Reduce the Agent’s resource usage via the dbengine disk space setting
- Correlate data between otherwise siloed monitoring systems
- Create custom dashboards to search for long-term trends in your infrastructure
- Store metrics from a master and its slaves in a centralized location
- Backup metrics in a separate system/location
Our new exporting connectors include Prometheus remote write, MongoDB, and AWS Kinesis Data Streams. Read the exporting documentation for more details on setting it up.
What else?
Our community asked for support for TLS 1.3 certificates, and we delivered. You can now configure Netdata’s web server to use the TLS version and ciphers of your choice, including 1.3. This applies to dashboard, API, and streaming connections. Read the documentation for details on configuring a TLS 1.3 certificate.
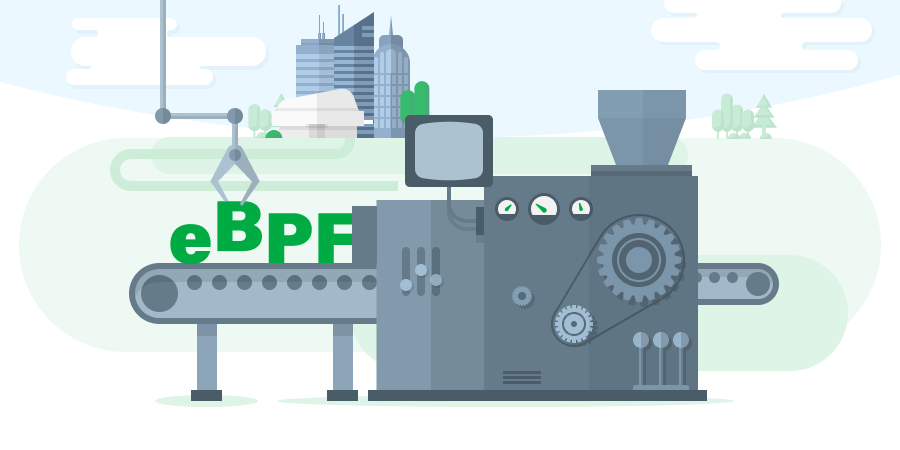
Our eBPF collector is still in a technical preview, but we’ve enabled compatibility with more Linux systems. We now support 13 different kernel versions that cover a broad spectrum of distributions and their versions. Plus, we’ve proven that the collector is extremely fast via a host of benchmarks.
There’s a lot more in v1.21 than what you can see in this blog post, so be sure to check out the release notes on GitHub for the full story.
And before we go, a special thanks those in our community who helped make v1.21 possible, even in these difficult times: Jiab77, SamK, kevenwyld, WoozyMasta, paulmezz, ManuelPombo, anayrat, Default, bceylan, peroxy, toadjaune, grinapo, m-rey, and YorikSar!