

As complexity of systems and applications continue to evolve and change, the number of metrics that need to be monitored grows in parallel. Whether you’re on a DevOps team, an SRE, or a developer building the code yourself, many of these components may be fragmented across your infrastructure, making it increasingly difficult to identify the root cause when experiencing downtime or abnormal behavior. To help solve this challenge, we built the Metric Correlations feature – an automated analysis tool that evaluates all your metrics to identify which have changed the most within a given period of interest.
The idea behind Metric Correlations is to try to speed up mean time to resolution (MTTR). While Netdata already provides every metric at a per-second interval, in real time, sifting through thousands of metrics to analyze what is relevant is a massive time sink, especially when you know you have a problem somewhere.
As part of our research, when building the Metric Correlations feature, we ran multiple tests against similar solutions to see how it compared. In the interest of full disclosure, we already knew that Netdata had some key advantages. First and foremost, Netdata collects and presents every metric at per-second intervals in real time, something unavailable in competing solutions. Many other solutions rely on centralizing metrics as opposed to having a distributed data architecture, like Netdata. This means that real-time root cause analysis can be challenging. One advantage that more centralized solutions might have is the ability to just throw many different ML algorithms at the problem and see what sticks, but given we don’t store the metrics we need to be a bit more careful and considered in how we analyse the data as we process it.
To demonstrate some of the key differences between how metric correlations work in Netdata versus other products, we set up a lab test to simulate a network traffic incident, then completed troubleshooting steps with both Netdata and another undisclosed monitoring solution.
The methodology
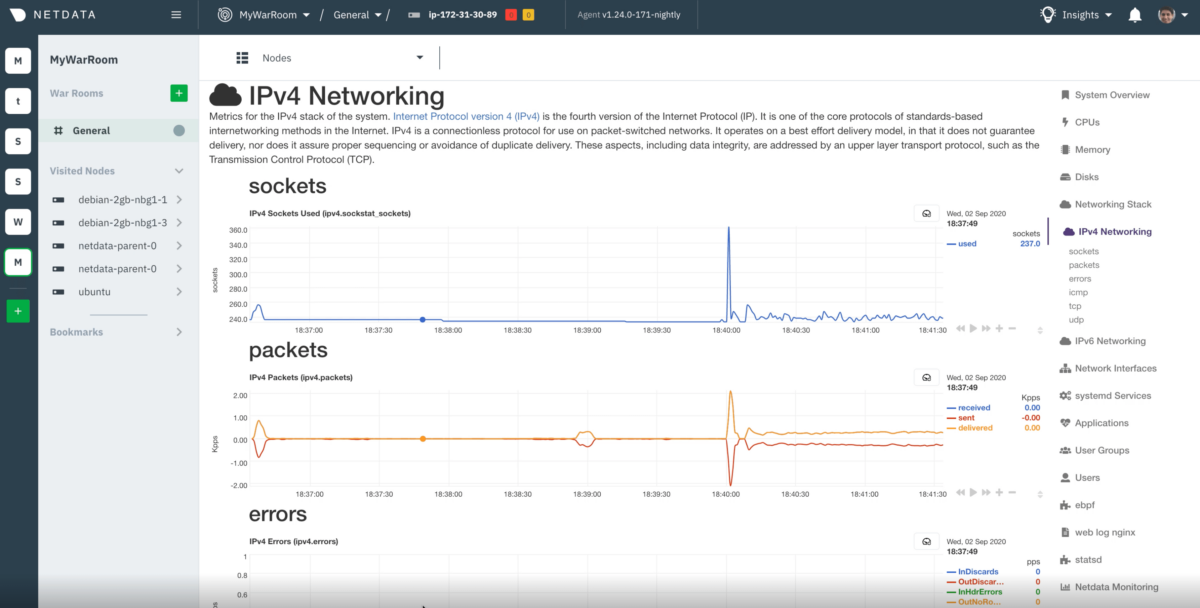
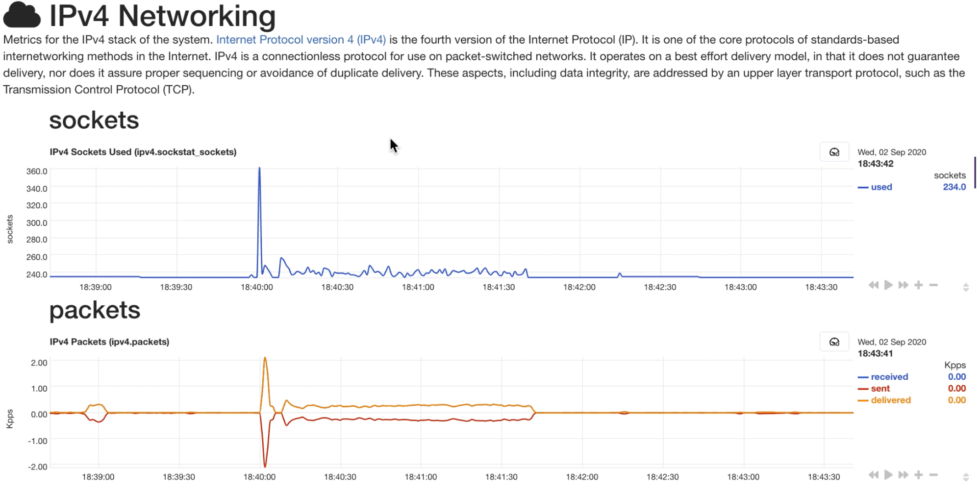
A primary virtual machine1(VM1) hosted an nginx web server, a Netdata agent (v1.24), and another undisclosed monitoring solution. Four secondary VMs were located in different geographic locations, and generated large network traffic requests to the primary virtual machine using siege2. As a result, outbound network traffic was created in VM1 for about 100s every 5 minutes.
The idea behind our lab tests is to show the novel approach of Netdata to real-time troubleshooting, which is our core focus. Netdata Cloud offers thousands of metrics out-of-the-box that can be analyzed in a few seconds in response to an anomaly, incident, or outage. Other solutions may offer cross-node correlations, but require quite a bit more configuration to be able to surface similar insights and come with considerable cost.
The design
Metric correlations is a FastAPI based microservice that receives two datasets – the “highlighted data” (based on your selected window) and the “baseline data” (which is the period preceding your highlighted window). Once we have these two windows of data for each metric the problem formulation then is to try and rank which metrics have changed the most from the baseline to the highlighted window.
To do this we leverage a tried and tested statistical test, the two sample ks test. This is a quick and efficient, non parametric, statistical test of whether two univariate distributions differ in a statistically significant way. From this we can rank all the metrics from those that look to have changed the most to the least – and this ordering is what is returned by the metric correlations service. Netdata Cloud then filters your dashboard charts and metrics accordingly. The idea being that those metrics that have changed the most between baseline and highlighted window should be somewhere obvious in the filtered results.
The evolution
By itself, having Metric Correlations available on a single node, it is extremely helpful when troubleshooting. With system architecture’s getting more and more complex, where services and products rely on multiple services and nodes, the need to be able to correlate events across these services is more demanding. At Netdata we are working on the evolution of this feature as well as ways to add additional algorithms so that users can quickly and iteratively explore which ones give the most useful insights for each specific investigation. Automated anomaly detection is also another core ML related feature we are working on and planning to launch in the near future.
If you haven’t experienced this powerful feature yet make sure to give it a try! Do send us your feedback and suggestions on it. For more information check our documentation, use our forums or engage with us on public discord channel.