What makes a storage device S.M.A.R.T.?
S.M.A.R.T. (Self-Monitoring, Analysis, and Reporting Technology) is a supplementary component built into many modern storage devices through which devices monitor, store, and analyze the health of their operation. Statistics are collected (temperature, number of reallocated sectors, seek errors etc.) which software can use to measure the health of a device, predict possible device failure, and provide notifications on unsafe values.
When S.M.A.R.T. data indicates a possible imminent drive failure, software running on the host system may notify the user so preventive action can be taken to prevent data loss, and the failing drive can be replaced and data integrity maintained.
smartd is a daemon that monitors the S.M.A.R.T. system built into many ATA-3 and later ATA, IDE and SCSI-3 hard drives.
Monitoring S.M.A.R.T. attributes with Netdata
Let’s start with getting Netdata installed on your system, if it isn’t already.
Netdata auto discovers hundreds of services, and for those it doesn’t turning on manual discovery is a one line configuration. For more information on configuring Netdata for S.M.A.R.T. monitoring please read the collector documentation.
You should now see the smartd_log section on the Overview tab in Netdata Cloud already populated with charts about all the metrics you care about.
Netdata has a public demo space (no login required) where you can explore different monitoring use-cases and get a feel for Netdata.
What S.M.A.R.T. attributes are important to monitor?
Depending on whether your storage device is SCSI based or ATA based the metrics that Netdata collects and the charts displayed will vary.
In this blog, we will be focusing on a monitoring an ATA hard drive. But for more information and what metrics can be monitored on SCSI hard drives please read the collector documentation.
Errors
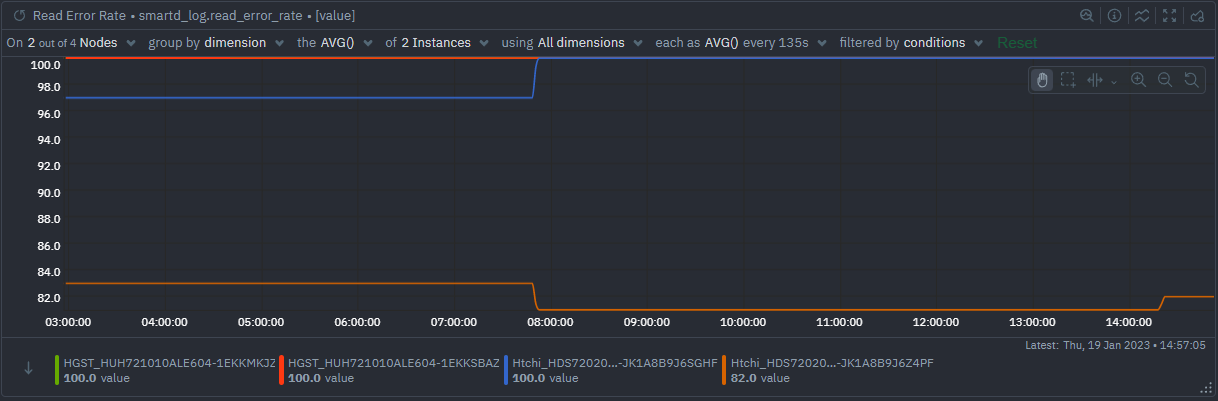
Read Error Rate The rate of hardware read errors that occur when the drive attempts to read data from the disk. This is an important metric to monitor as it can be used to detect and prevent potential hard drive failures; if the read error rate is high, it may be a sign that the drive is failing.
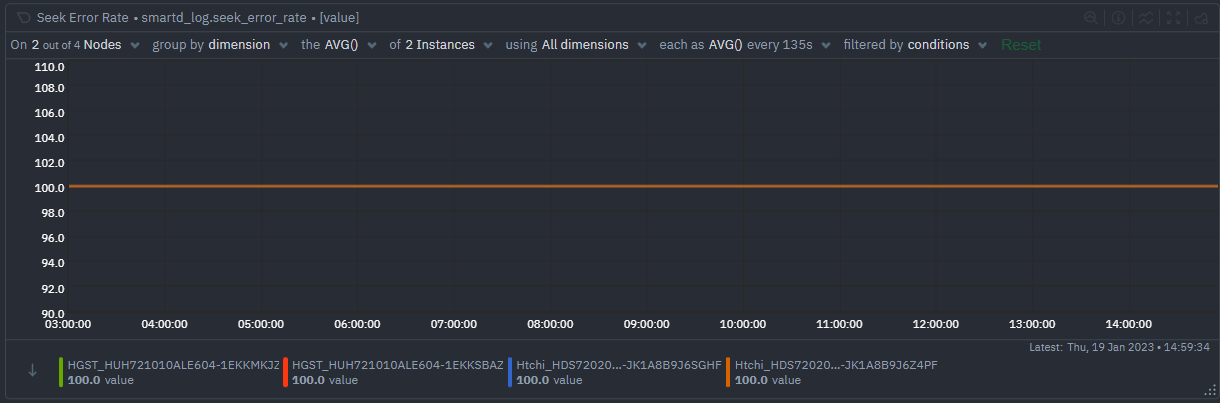
Seek Error Rate
The number of errors that occurred while the hard drive was seeking a certain sector on the disk. A high Seek Error Rate typically indicates a failing or weak drive, and can be an early warning sign of impending hardware failure. Normal values for Seek Error Rate should be 0, so any value higher than 0 should be investigated.
Soft Read Error Rate Soft read errors occur when the drive is unable to read data from a sector, but is able to successfully recover from the error after retries. Soft read errors are generally not as severe as hard read errors, as the drive is able to recover from the error. A small number of these errors might be caused by minor electrical glitches and is no direct cause for worry as long as it is transient in nature.
Write Error Rate The number of data write errors that occur per second on a hard disk drive.
External Failures
UDMA CRC Error Count The UDMA CRC Error Count is an S.M.A.R.T attribute, which measures the number of errors that occur during the transfer of data between the hard drive and the host device. It is a metric of the integrity of the data being transferred and is an important indicator of the health of the hard drive.

SATA Interface Downshift SATA Interface Downshift is a S.M.A.R.T attribute that measures the number of times a SATA interface has downshifted its speed to a lower data transfer rate. This metric is important to monitor as it indicates that the SATA interface is being throttled, which can lead to degraded performance and latency.
Performance
Throughput Performance Throughput Performance is a S.M.A.R.T. attribute that measures the rate of data transfer in a given period of time. It can be indicative of a number of problems within a system, such as potential bottlenecks in the system architecture or a faulty hardware component.

Seek Time Performance Measures the time it takes for a disk drive to move the read/write head from one point to another. It is an important metric for monitoring the performance of storage devices as it affects the overall speed and responsiveness of the hardware. Poor Seek Time Performance can cause delays in data retrieval, resulting in slower application performance and degraded user experience. Monitoring this attribute can help identify and prevent issues that could lead to application or system slowdowns.

Power
Start/Stop Count The number of times a device has been powered on and off.

Power-on Hours This attribute tracks how many hours the device has been powered on.

Power Cycles Tracks the number of times a device has been power cycled.

Unexpected Power Loss Tracks the number of times a device has been unexpectedly powered off.
Spin
Spin-up Time This attribute measures the time it takes for the disk drive to spin up from a powered-down state to a fully operational state.

Spin-up Retries Spin-up retries are a S.M.A.R.T attribute that measures the number of times the hard drive has attempted to spin up and failed. If the number of retries is over 5, it could be an indication of a problem and should be investigated further.

Calibration Retries Calibration Retries is a S.M.A.R.T attribute that measures the number of times a hard disk drive has attempted to recalibrate its read/write heads. It is generally observed that the higher the number of retries, the lower the overall reliability of the hard disk drive. This is because the more retries that are needed, the more degraded the performance of the hard disk drive becomes.
Temperature
Temperature is an important metric to monitor and observe when it comes to S.M.A.R.T. attributes. Temperature is related to the cooling system, which is vital to the health and longevity of the system. If the temperature of the system gets too high, it can cause significant problems such as decreased performance, hardware damage and even system failure.
Normal temperature ranges for a system depend on what type of hardware is being used, but generally speaking, as long as the temperature does not exceed 70 degrees Celsius (158 Fahrenheit) for extended periods of time, it should be considered safe. It is important to monitor temperature regularly to ensure that it does not increase to unsafe levels, and if it does, take measures to cool the system down.

Wear
The hard drives we are monitoring in this example is in pretty good state and has not had to deal with wear - so the charts you’ll see here are empty, but if you do have an older hard drive these charts will be very interesting to monitor.
Reallocated Sectors Reallocated Sectors (also known as reallocated sector count) is a S.M.A.R.T attribute that measures the number of sectors on a hard drive that have been reallocated due to bad sectors. Reallocated sectors can occur due to physical damage to the drive, or due to a bad controller or deteriorating media.

Reallocation Events Measures the number of reallocation events that have occurred.

Current Pending Sectors Attribute that measures the number of sectors on the disk that have been marked as “pending” for writing operations.

Offline Uncorrectable Sectors
Attribute that measures the number of sectors that are unable to be read or written to

Percent Lifetime Used Percent Lifetime Used is a S.M.A.R.T. attribute that measures the percentage of the lifetime of the disk that has been used.