
The life of a sysadmin or SRE is often difficult, but occasionally very simple things can make a huge difference. Basic monitoring of your systemd services is one of those simple things, which we sometimes overlook. The simplest question one would want to know is if the thing that’s supposed to be running is actually running at all. If you use systemd services, you can guarantee an answer to that question within minutes using Netdata.
The Netdata systemd units state collector can continuously monitor any systemd service and notify you if it crashes. In fact, it can monitor any systemd unit, including systemd sockets, systemd paths etc.
After signing up in https://app.netdata.cloud and installing netdata, you just follow the instructions here to enable the collector and tell it what units you are interested in monitoring.
The quickest thing you can do is have a single job for all services, as follows:
jobs:
  - name: service-units
    include:
      - '*.service'
Or maybe you just want to monitor a single service:
jobs:
  - name: my-specific-service-unit
    include:
      - 'my-specific.service'
The “include” directive utilizes the shell file name pattern syntax.
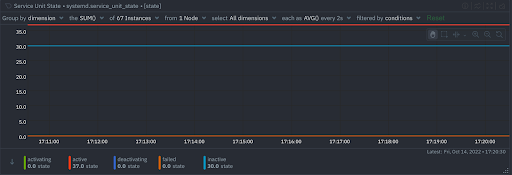
Whatever you specify will result in a time series for each data collection job, showing the health of the matching systemd units, and automated health checks that trigger alerts if a systemd unit goes into the “failed” state.
If you want to ensure a service is running no matter what, you could add your own alerts for the “inactive” state as well.
e.g. when you ./edit-config health.d/systemdunits.conf you can make a copy of the following…
## Service units
 template: systemd_service_unit_failed_state
       on: systemd.service_unit_state
    class: Errors
     type: Linux
component: Systemd units
     calc: $failed
    units: state
    every: 10s
     warn: $this != nan AND $this == 1
    delay: down 5m multiplier 1.5 max 1h
     info: systemd service unit in the failed state
       to: sysadmin
… and change the new copy to:
## Service units
 template: <b>systemd_service_unit_inactive_state</b>
       on: systemd.service_unit_state
    class: Errors
     type: Linux
component: Systemd units
     calc: <b>$inactive</b>
    units: state
    every: 10s
     warn: $this != nan AND $this == 1
    delay: down 5m multiplier 1.5 max 1h
     info: systemd service unit in the <b>inactive </b>state
       to: sysadmin
You could even automatically execute a script other than the default alarm-notify.sh every time an alert changes state, by providing a custom exec option to the alert configuration. That script could, for example, attempt to start a monitored service again.
There’s nothing else to it really. The collector has a few more options like how frequently to check the state, but you really don’t need much more than a simple configuration. With Netdata, you can start receiving notifications for failed systemd services in just a few minutes!
So f you haven’t already, sign up now for a free Netdata account!
We’d love to hear from you – if you have any questions, complaints or feedback please reach out to us on Discord or Github.
Happy Troubleshooting!